How to improve reading instruction is a widely discussed issue among researchers, practitioners, and politicians. The use of computers in initial reading instruction has been regarded as one way of improving students’ reading, and different approaches have been elaborated concerning computer use in reading instruction. In recent years, many teachers have started to use something referred to as “learning to read through writing on computers.”1 This article explores this and tries, based on a project in four primary schools, to look into whether the use of computers in initial reading instruction actually makes a difference for students’ performance on reading tests.
A municipality in the Stockholm region concluded in spring 2012 that their students’ results on the national test in Swedish in Grade 3 were not as good as they wished it to be. It was decided to invest in a project that the municipality hoped would improve the results. Interested schools were invited to participate in a project and were offered extra resources to support reading and writing instruction for students who were to start Grade 1 in autumn 2012. The project was supposed to contain in-service training for the participating teachers, support to use computers as an important part of initial reading, and writing instruction and more resources to provide early remedial education to students with problems with reading and writing development. As a part of the project, it was decided not only to implement the project, but also to evaluate it. Contacts were established with interested researchers, and we accepted an offer to follow the students over a period of three years. In addition to the two project schools, two other schools in the municipality that did not participate in the project were contacted to be control schools in the study.
This article is the result of the longitudinal study that came out of this. The purpose of this article is to see if there were any differences between the schools in respect to students’ reading and writing skills at the beginning of Grade 1 and at the end of Grade 3 and whether possible differences between the students’ performance in the different schools can be explained by the use of computers.
Although the project contained three elements (in-service training for participating teachers, support to use computers, and early remedial education), this article will focus on the use of computers in initial reading and writing instruction.
Literature Review
The use of computers in early reading and writing instruction can be approached from different levels. The use of computers in general in initial reading and writing instruction can be studied and then more specifically the use of computers in reading instruction can be studied. We will start with the general use of computers in reading and writing instruction and then move to the more specific use of computers in the reading and writing instruction that to some extent guided the teachers in this study.
Several research overviews including a larger number of studies have been made on the effect of using computers in reading and writing instruction. In 2000, the National Reading Panel presented a comprehensive overview of research about reading and writing instruction (National Institute of Child Health and Human Development [NICHD], 2000). Their conclusion then was that computers seemed to motivate the students, but that existing research was rather limited and more research would be needed. In 2009, the use of computers in reading instruction was one of many areas included in Hattie’s large meta-analysis (2009). In total, Hattie found eight meta-analyses that had looked at the use of computers in reading and writing instruction. Hattie concluded that when computers were used to improve students’ spelling, there were positive results, but for all other use of computers in reading and writing instruction, no strong impact could be seen. Håkansson and Sundberg (2012) looked at Information and Communication Technology (ICT) use as a success factor and found no strong indications that the use of computers has a positive impact on learning (p. 240), but they also concluded that it may have a positive impact on students’ motivation and could provide opportunities to train cooperation and independence (p. 248). As a part of the SKOLFORSK project, Taube, Fredriksson and Olofsson (2015) made an overview of research about reading and writing instruction for young children that contained a section on the use of computers in reading and writing instruction. In total, 19 meta-analyses were found that had been published after the year 2000 and were based on 1,500 articles in peerreviewed journals. The results of these analyses showed the effect size was usually quite modest. These articles covered many different types of computer use; in the overview, a distinction was made between those that dealt with reading and those that dealt with writing. Generally, the effect size tended to be larger when computers were used for writing instruction than for reading instruction. It was also noted that the effect size for using computers in writing instruction was not bigger than the effect size for using other methods for specific writing instruction.
The use of computers in the project schools was not just a general use, but was inspired by the approach introduced by Trageton (2005, 2014a). Although Trageton is often presented as the inventor of the method referred to as “learning to read through writing on computers,” similar ideas had been introduced earlier. As early as 1980, IBM promoted a method referred to as “Writing to Read,” which was examined by Slavin in 1991. Slavin (1991) found 29 different evaluations of the methods from different school districts in the US. He could not find any obvious differences in reading results between those who had been taught according to the method and those who had received more traditional reading instructions, but he assumed that more research would be needed.
Trageton (2004) presented a method for using computers in reading and writing instruction. The ideas presented in Trageton’s books have been further elaborated in other books (Lövgren, 2009; Hultin & Westman, 2014). In short, the method contains the following elements:
- Use of computers in reading and writing instruction;
- Students are encouraged to write before they know all letters and before they have cracked the reading code;
- Use of a computer or tablet as the primary writing tool in preschool classes and in Grade 1 and no instruction during these years on how to write by hand;
- The students work together in pairs with the computers; and
- The students’ own written texts are used as a starting point for instruction.
Some studies have evaluated the impact of this method. These studies have reported some findings that would suggest good results when the method has been used (Agélii-Genlott & Grönlund, 2013, 2016; Folkesson, 2004; Folkesson & Swalander, 2007; Liberg, 2014). Unfortunately, these studies suffer from serious methodological issues. It should be noted that Trageton has not published any articles in scientific peer-reviewed journals. In his books, he referred to some unpublished studies in which he claims that there was no difference in reading results, but wrote results in favour of students who followed his methods. Folkesson (2004) examined two school classes that had followed a method similar to the one suggested by Trageton and found that that classes had slightly better results in reading than the average results of Swedish students in the then-latest available national assessment made in 1995. Folkesson and Swalander (2007) tested students from grade 2 who had used computers to write as their reading instruction and compared them with other students who had received more traditional reading instruction. The students who had received their instruction with the support of computers had better results than the other students. Agélii-Genlott and Grönlund (2013) tested students who had received reading instruction inspired by Trageton’s ideas using material from the National Agency for Education (the testing material ‘Nya Språket lyfter’) and compared them with another group who had received more traditional reading instruction. The group that used computers had better results on reading and much better results on writing. In a larger study, Agélii-Genlott and Grönlund (2016) also used the national test in Swedish to compare students in Grade 3 who had received reading and writing instructions inspired by Trageton with students who had received a more traditional instruction. Among the students who had received instruction inspired by Trageton, a significantly higher number had achieved the passing level on the test than among the other students. Liberg (2014) compared two Grade 3 classes who had used computers in reading and writing instruction according to Trageton’s methods with the results of other classes in the same grade in the same city. The two studied classes scored lower than the other classes in the city on the parts of the test that concerned reading, but had better results on writing.
It should be noted that there were methodological problems in several of the studies described above. To assess the effects of an intervention such as the use of a specific method for reading and writing instructions, the test should be repeated several times, and the test used should be standardised. Compared groups should be as equal as possible, and it is preferable that participants be matched through some kind of pre-intervention test.
Based on this overview of relevant research, there is no strong evidence that the use of computers in reading instruction is better than more traditional reading instruction. In the case of writing instruction, there seems to be a stronger case for the use of computers, but in comparison with other methods that promote writing skills, the use of computers does not seem to yield exceptional results. The results from studies that have specifically looked at the type of computer use in reading and writing instruction advocated by Trageton do not provide undisputable results, but tend to show the same thing as the more general research on the use of computers in reading and writing instruction. There are no obvious advantages related to results in reading, but there may be an advantage related to writing skills.
Theoretical Framework
To explore the impact of computer use as an important part of initial reading and writing instruction, it is essential to establish a framework in which we can give a general description of reading and writing development among young children during their first years in school. Almost all children learn how to read and write, but how well and how fast they learn may vary. The reasons behind this variation can be found in a combination of factors linked to the individual, his or her background, education, and the environment in which the child grows up. There is more research about the development of reading than the development of writing (Taube, 2011). Figure 1 gives an overview of factors assumed to have an impact on the reading and writing development of a Grade 3 student.
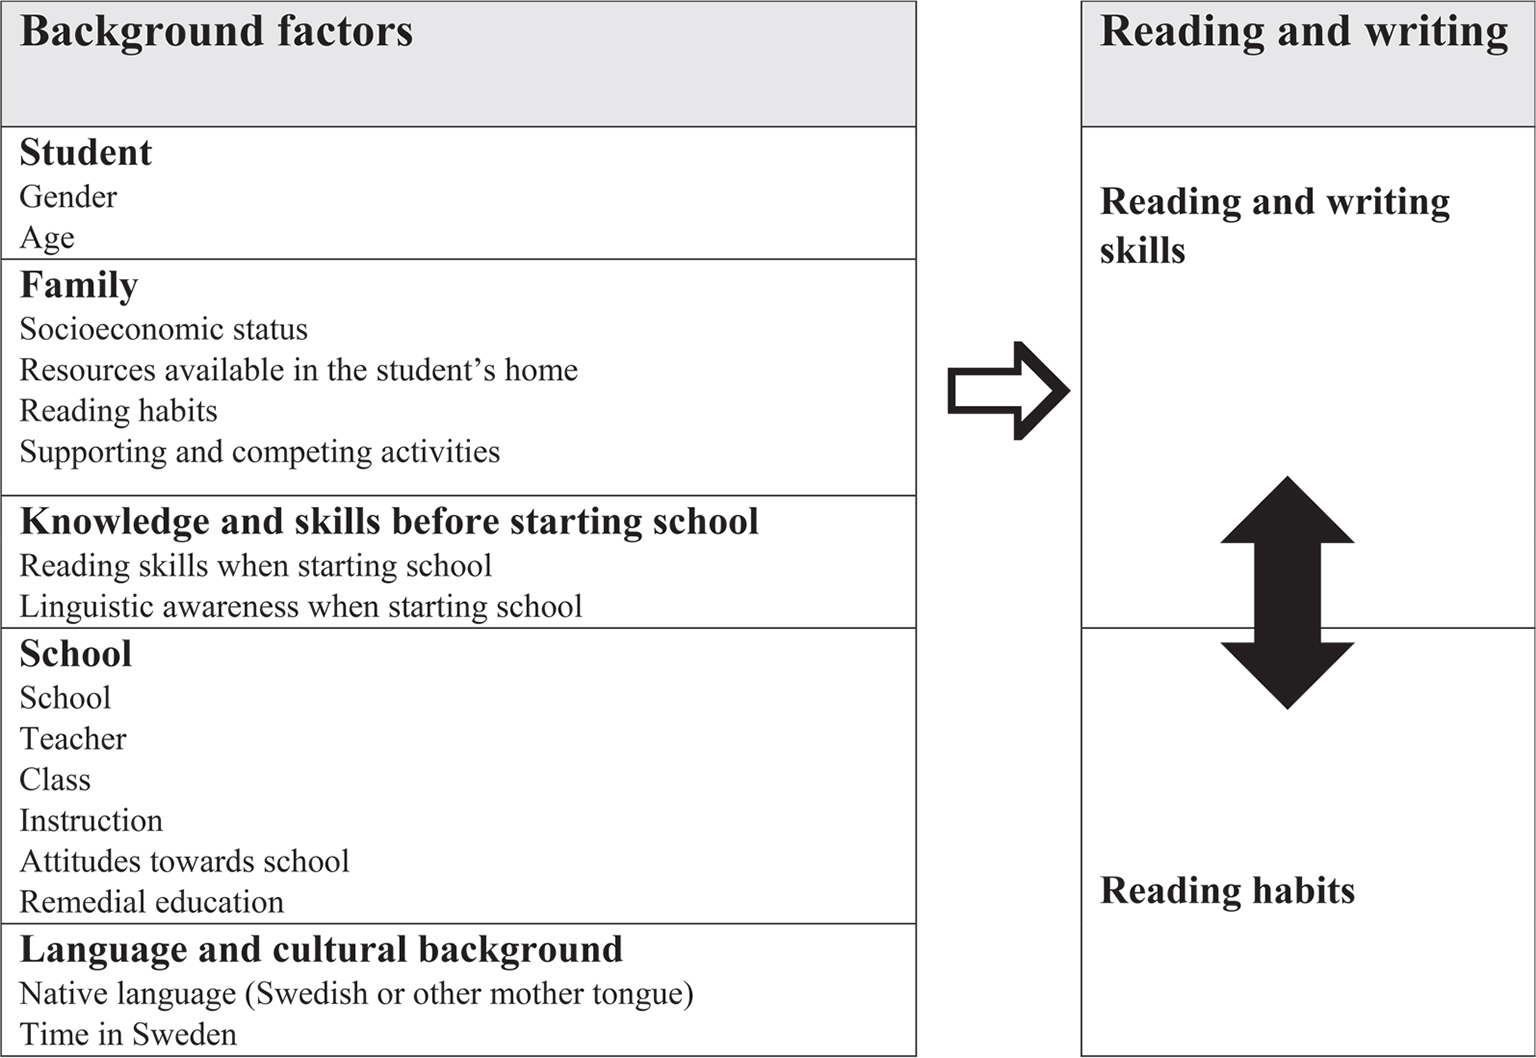
Factors affecting reading and writing development that are directly related to each student are gender and age. We know that girls on average read better than boys (see for example Fredriksson & Taube, 2012; Fredriksson et al., 2018a; Skolverket 2010, 2012; Wagemaker, 1995), and that older students usually read better than younger students (see for example Snow, Burns & Griffin, 1998). Concerning the age factor, we know that among younger students it makes a statistical difference whether the students are born early or late in the year (see for example Fredriksson, 2002; Fredriksson & Taube, 2001, 2012).
The socioeconomic background of students also influence their reading and writing development. There is an association between the socioeconomic status of a family and a student’s reading as well as between reading habits and reading activities in the family and student reading ability (see for example Fredriksson & Taube, 2012; Skolverket, 2010, 2012). Students from homes with higher socioeconomic status read on average better than students from homes with a lower status (see for example Fredriksson & Taube, 2012; Skolverket, 2010, 2012), but other factors related to the family seem to have an impact on the development of reading as well. Students from homes where reading and writing is more actively supported read on average better than students from homes where this support is weaker (see for example Fredriksson & Taube, 2012; Hart & Risley, 1995; Organisation for Economic Cooperation and Development [OECD], 2001).
Family factors also influence the skills and knowledge students have when they start school. Students who have already learned to read have an advantage compared to other students when they start in Grade 1 (Skolverket, 2012). We also know that linguistic awareness influences how easily a student will learn to read and write when he or she starts school (Snow et al., 1998; Taube, 2007). A crucial part of linguistic awareness is phonological awareness (Taube, 2007; Taube et al., 2015) as well as the student’s knowledge of letters (Scarborough, 1998).
A number of factors related to the school have an impact on reading and writing development. Some schools may give their students better support than other schools. This can be related to how teachers teach, but also to the composition of students in the school (Fredriksson & Taube, 2012). Some teaching methods and access to certain resources may positively influence reading and writing development. The general background of the students in a school may influence the results of individual students. If many students come from motivated and supporting homes, this may affect the whole climate in the school and also positively affect students from less motivated and supportive homes.
The language and cultural background of the students is another factor that influences reading and writing development. Students with a mother tongue other than Swedish read and write on average less proficiently in Swedish than the students with Swedish as their mother tongue (see for example Fredriksson, 2002; Fredriksson & Taube, 2001; Fredriksson et al., 2018b). It should be noted that the variation in this group is rather large. The importance of the language spoken at home and cultural background is also related to other factors such as the socioeconomic status of the family, activities in the family, the school, and gender.
All the above-mentioned factors and those indicated in Figure 1 influence the reading and writing development of the students, but they also influence the reading habits of the students. Reading habits are then closely linked to reading and writing development (Fredriksson & Taube, 2012) as indicated in Figure 1. In this context, this phenomenon is sometimes referred to as the Matthew effect (Stanovich, 2000). For students whose reading is improving, it becomes easier to read; as they start to read more, their reading will improve even more. For those who find it difficult to read, the opposite is true: They will read less, which leads to their reading not improving. Depending on how a student’s reading develops, negative or positive spirals will occur related to the student’s skills.
When the reading and writing development of students are studied and comparisons are made between students who have received initial reading and writing instruction in schools using different approaches to the instruction, it is important to take all the factors mentioned above and in Figure 1 into consideration to confirm whether observed differences result from differences related to instruction or any other factor.
Methods
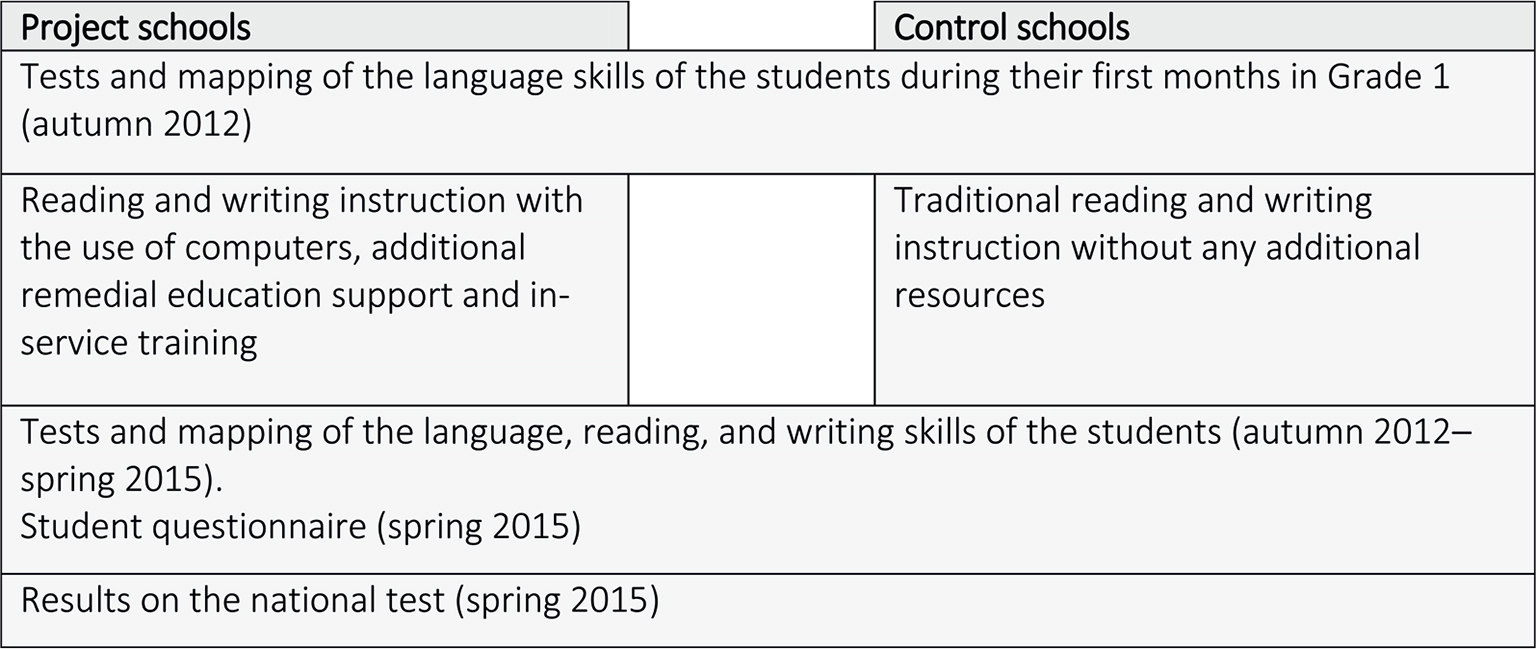
The study featured a quasi-experimental design, with 110 students in two project schools and 59 students in two control schools (see Table 2 for further details). The control schools were similar to the project schools. They were located in the same municipality, but did not get the same resources as the project schools. To explore the extent to which the use of computers in reading instruction made a difference, we followed students in the schools from the autumn semester in Grade 1 to the spring semester in Grade 3.
Students’ linguistic skills were tested regularly with different test instruments from Grade 1 to Grade 3. In addition to the tests, the students also completed a questionnaire and the teachers were interviewed. Parts of the collected data were used to statistically estimate the effect of the intervention in the project schools.
Participants
Two schools that participated in the project were identified as project schools by the educational office of the municipality. They received additional resources so that they could offer in-service training to participating teachers and provide computers to use in initial reading instruction. The in-service training consisted of regular meetings among the teachers, reading books together, study activities organised in the schools and participation in conferences. The in-service training contained more specific information about the use of digital media in instruction and about reading and writing development in general. The project schools also received more hours for remedial education, which meant that students who had been identified as having a need for more support could be given remedial education during longer or shorter periods during the first school year. According to the interviews with the teachers in the project schools, Trageton’s recommendation on how to use computers in initial reading and writing instructions were followed as described above. Computers were used as the main tool for writing, but the students had to share a computer on two, which meant that they sometimes had to write by hand. No instruction in handwriting was given. Not all advice given by Trageton in his books concerning procedures and in which order to do things was followed. Two other schools that matched the project schools in terms of student population were identified as control schools. The control schools did not get any extra resources and were encouraged to continue with reading and writing instruction as usual. The main difference between the project schools and the control schools was that in the control schools, reading and writing instruction was given as they had been given for earlier groups of students, while the project schools received support that made it possible to actively use computers as an integral part of the reading and writing instruction. All four schools voluntarily agreed to participate. Schools A and B were the control schools, and Schools C and D were the project schools.
| School | Share of immigrant students (%) | Share of parents with tertiary education (%) | Share of teachers with a degree in education (%) |
|---|---|---|---|
| A | 14 | 40 | 84.3 |
| B | a | 61 | 86.5 |
| C | 7 | 53 | 91.8 |
| D | 15 | 56 | 89.2 |
| National level | 19 | 54 | 86.3 |
Note. a Less than ten students (Skolverket, 2018).
The schools included in this study had a lower share of students with immigrant backgrounds than the national level of 19% (see Table 1). The share of parents with tertiary education and the share of teachers with degrees in education is close to the proportion at the national level.
In the four schools, all students who started in Grade 1 autumn 2012 were part of the study, but as the study included collection of data from the students, their parents were contacted. The parents received information about the study, its purpose, and notice of voluntary participation. The children also received information about the project from their teachers. Parents who agreed that their children could participate were asked to complete a consent form. Table 2 shows the number of students in Grade 1 who started in autumn 2012 and how many of these students’ parents gave permission for their participation.
| School | Number of students | Number of students with parents’ permission to participate | Percentage of students with permission to participate | Number of students for whom a Full Set of Data are Available |
|---|---|---|---|---|
| A | 39 | 33 | 85 | 33 |
| B | 30 | 26 | 87 | 26 |
| C | 34 | 30 | 88 | 26 |
| D | 93 | 89 | 96 | 84 |
| Project schools | 127 | 119 | 94 | 110 |
| Control schools | 69 | 59 | 85 | 59 |
| Total | 196 | 178 | 91 | 169 |
In total, 178 students had permission to participate. As some students moved to other schools during the three years of the study, these students could not be part of the whole study. New students that came to the classes could not be added to the study.
The actual population participating in the study are those students who started in Grade 1 in autumn 2012 in the four involved schools, who were still in these schools at the end of Grade 3 in spring 2015, and whose parents had signed the consent forms. The least column in table 2 shows the distribution of students among the four participating schools. In total, data are available for 169 students from two project schools (C and D) and two control schools (A and B).
Instruments
To collect data, information was collected about the students (questionnaire); the students’ language, reading, and writing skills (tests and mapping material); and classes and schools (interviews with teachers and principals).
To get basic data about the students, information was collected from the teachers. The teachers indicated year of birth, month of birth, gender, and mother tongue for each student. The teachers were instructed to indicate that a student had a mother tongue other than Swedish if they knew that language other than Swedish was spoken on a regular basis in the home and if the student was assumed to have knowledge in that language. Information was also collected directly from the students about their age, gender, mother tongues, resources at home, attitudes towards school, reading in their leisure time, reading instruction, and reading interest. This was done with a questionnaire that was mainly inspired by the questionnaire used in PIRLS 2011 (Skolverket, 2012). The students answered the questionnaire in writing, but the teachers read the questionnaire for the students and gave some assistance on how to answer the questions, which were mainly multiple choice questions. Some additional information was also collected from the remedial teachers about which students had received remedial instruction, how many hours they had received such instruction, and how these hours had been distributed over the semester.
To get data about the students’ reading and writing development, different tests and mapping materials were used. These tests and mapping materials were the same as those that were normally used in the schools. The difference was that this data was now reported and stored for further analysis. The information from the class lists, the tests, and the mappings were reported to the person in the municipality responsible for collecting the material and then further reported to the Department of Education at Stockholm University. The data transferred to Stockholm University did not contain any names of students, only a number for each student that indicated school and class. The tests used are listed in Table 3.
| Name of the test (Original Swedish name within brackets) | Areas tested | Source |
|---|---|---|
| Letter control (Bokstavskontroll) | Recognition of small and large letters. | Locally used test |
| Fonolek | An assessment of the students’ phonological awareness. | Hemmingsson, 1992 |
| Language screening (Språkskrin) | Language understanding. | Bengtsson, Dickman, Öhman & Magnusson, 2003 |
| Good reading development: mapping and exercises (God läsutveckling: kartläggning och övningar) | Covers five dimensions: phonological awareness, decoding of words, reading fluency, reading comprehension, and reading interest. | Lundberg & Herrlin, 2003 |
| Spelling (Rättstavning) | Spelling of words in sentences. | Locally used test |
| Reading chains (Läskedjor) | Identifying words and letters in chains of letters. | Jacobsson, 2001 |
| Which picture is correct? (Vilken bild är rätt?) | Linking sentences to pictures. | Locally used test |
| Word understanding (Ordförståelse) | Form pairs of words with the same meaning. | Järpsten & Taube, 2013 |
| The national test spring 2015 (Nationella Provet för vårterminen 2015) | Eight sections: speak, read narrative text, read expository text, read a narrative text aloud, conversation about a narrative text, write a story, write spelling and punctuation, and write an expository text. | Skolverket, 2015a |
Three tests will be used for the analysis of the students’ results in Grade 3: the national test (Skolverket 2015a), the mapping material Good Reading Development (Lundberg & Herrlin, 2001) and Reading Chains (Jacobsson, 2001). The national test is used for all students in Grade 3 to determine whether the knowledge requirements have been met or not. The mapping material Good Reading Development is not really a test, but a material to help the teachers to do a continuous formative assessment of their students’ reading development. It is based on how the teachers have estimated the students’ ability. Reading Chains (Jacobsson, 2001) is a screening instrument developed to assess students’ decoding ability. It has been standardized according to relevant norms for test development.
In addition to the tests, the questionnaires and lists from the teachers, information were also collected through interviews with the teachers responsible for the involved classes, the remedial teachers who taught students in the involved classes, and the principals of the involved schools. The purpose of the interviews was to get more information about teaching methods in the classes, how the teachers have experienced the work in the classes, and about the schools in general.
Data Collection
Data were collected from September 2012 to May 2015. Table 4 shows which year and semester different material was collected.
| School year | Semester and year | Tests, mapping and questionnaires |
|---|---|---|
| 1 | Autumn 2012 | Letter control |
| Fonolek | ||
| Language screening | ||
| Good reading development | ||
| Spring 2013 | Reading chains | |
| Spelling | ||
| Good reading development | ||
| 2 | Autumn 2013 | Reading chains |
| Which picture is correct? | ||
| Good reading development | ||
| Spring 2014 | Good reading development | |
| Word understanding | ||
| Spelling | ||
| 3 | Autumn 2014 | Reading chains |
| Which picture is correct? | ||
| Good reading development | ||
| Spring 2015 | National test | |
| Good reading development | ||
| Student questionnaire |
Interviews were held in four rounds. A first set of interviews was held with the teachers responsible for the involved classes, the remedial teachers, and the principals from September to November 2012. A second set of interviews was held with the teachers, the remedial teachers, and one principal from November to December 2014. A third set of interviews was held with the principals from May to June 2015. A final round of interviews was held with the teachers and remedial teachers in September 2015.
Analysis
In the analysis, we took advantage of the many different tests that the students took from the first to the third grade. The results from the various tests were coded according to the instructions for each test. The data analysis was conducted with Stata 14.2 (StataCorp., 2015). Descriptive statistics were computed and the test results for the students in the project schools were compared with the results for the students in the control schools. Effect sizes were calculated to obtain an impression of the magnitude and allow for a comparison of differences (Pedhazur & Pedhazur Schmelkin, 1991). In accordance with common practice, effect sizes greater than 0.2 were considered small, greater than 0.5 were considered medium, and greater than 0.8 were considered large (Cohen, 1988). Because the students were not selected by an independent sampling procedure, t-tests and statistical significances will not be reported (see e.g. Heckman, 1979; Wilkinson, 1999). Instead, effect sizes were used to indicate the magnitude of differences between the project schools and the control schools.
Moreover, percentile ranks (see e.g. Mellander & Svärdh, 2017) were computed for all test results to be able to get all the results from the various tests on the same scale to compare the students’ performance from the first to the third grade. In this approach, the students’ test scores were replaced with their rank in the distribution of test results; the distribution ranges from zero to 100. An individual who had the highest score on the test received the percentile rank 100, the one that had half of the students before him or her and half of the students after him or her was given the percentile rank 50, and the one with the lowest score received the rank zero. When a rank was computed for all students’ results, the mean of the percentile ranks for the control schools and project schools were calculated.
In addition, multiple regression analyses were computed and the variables in Table 5 were used as independent variables. These variables were chosen in accordance with the factors influencing students’ reading in Figure 1. The purpose of the multiple regression analysis was to estimate the predictor project school while taking into account other independent variables known to be important in reading performance. The socioeconomic index was the sum of the following questionnaire items, number of books at home, possessions (computer, a desk to use, own books, own mobile phone, own TV, a globe, a piano, and other music instruments). The higher the value, the more possessions the students had reported. The hypothesised and tested regression models were set up drawing on the factors influencing reading development known from previous empirical findings described in Figure 1.
| Variable | Explanation | Coding | Mean | SD |
|---|---|---|---|---|
| Project school | If the students were taught in a project school | 1 = Yes 0 = No | n.a. | n.a. |
| Socioeconomic status | The sum of the result on 11 questions about socioeconomic status | Range 2–10 | 5.7 | 1.5 |
| Remedial education hours | The time the student received remedial education | Range 0–122 hours | 5.5 | 15.9 |
| Month | Born early in the year – lower value | January = 1. . . . December = 12 | 6.2 | 3.4 |
| Phonological index | The sum of the results on the Fonolek test (done in autumn 2012 in Grade 1) | Range 6–36 | 29.6 | 7.2 |
| Teacher change | If the class changed teacher | Yes = 1, No = 0 | n.a. | n.a. |
| Swedish L1 | If the student had Swedish as their first language | Yes = 1, No = 0 | n.a. | n.a. |
| Girl | Gender | 1 = Girl, 0 = Boy | n.a. | n.a. |
Results
In this section, we present the results for the various tests in Grade 3 and thereafter the multiple regression analysis. The aim was to measure the influence of the teaching method, learning to read through writing on computers, on the students’ reading and writing development by controlling for several variables in the regression models. In the regression models, the predictor variable “Project school” indicates the estimated effect of the teaching method.
Tests in the First Grade
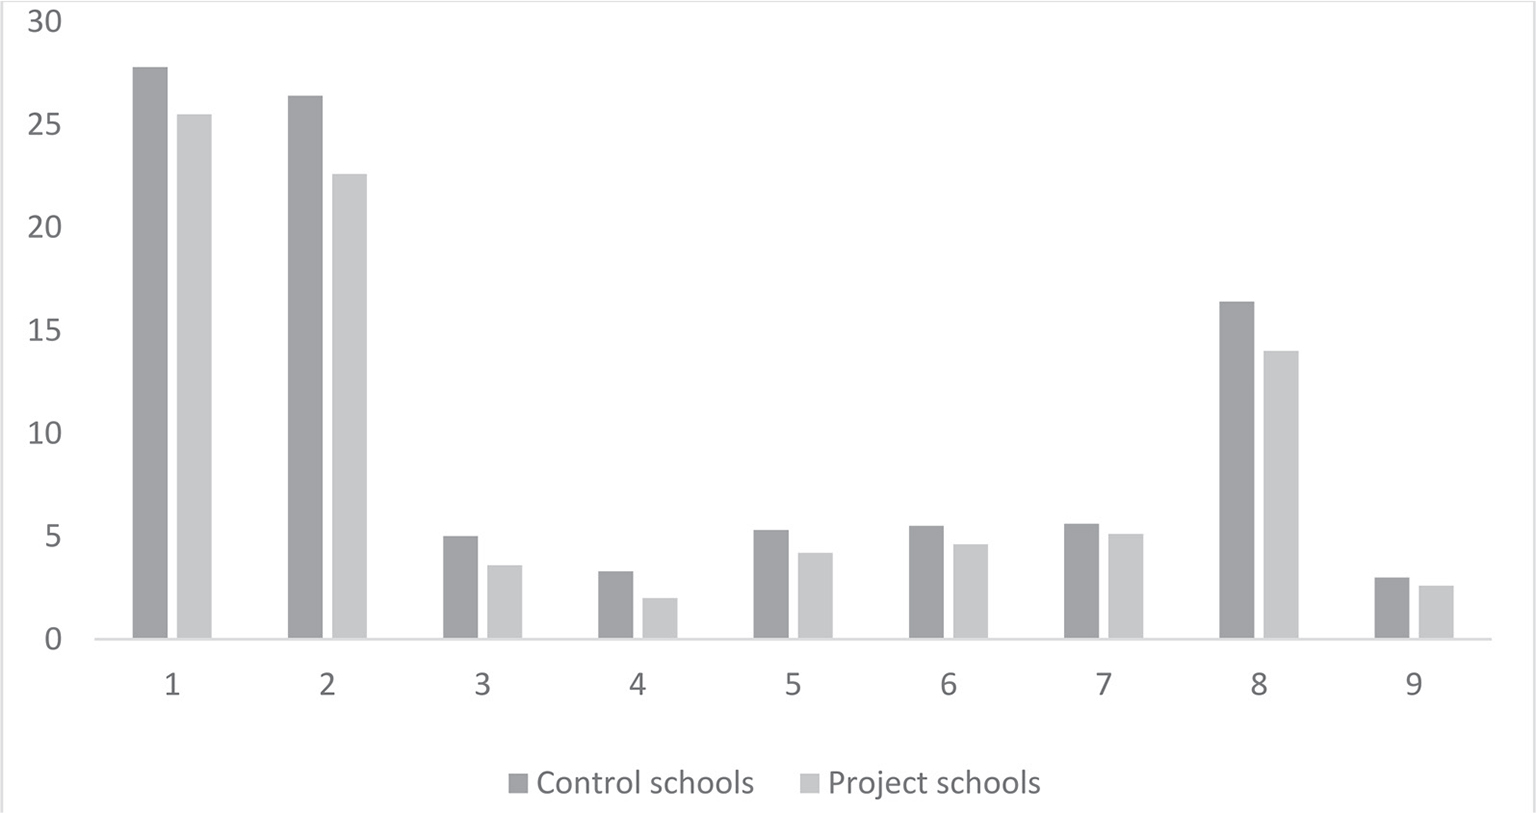
In the first school year, the students in the control school managed the various tests slightly better than the project schools (see Figure 2). The tests used were (a) Letter control, uppercase; (b) Letter control, lowercase; (c) Letter control, words; (d) Letter control, sentences; (e) Fonolek, phonological awareness, sound segments; (f) Fonolek, phonological awareness, the first sound; (g) Fonolek, phonological awareness, sound synthesis; (h) Fonolek, phonological awareness, total; and (i) Language screening (see Tables 4 and 5).
The Results of the National Test in Swedish in Grade 3
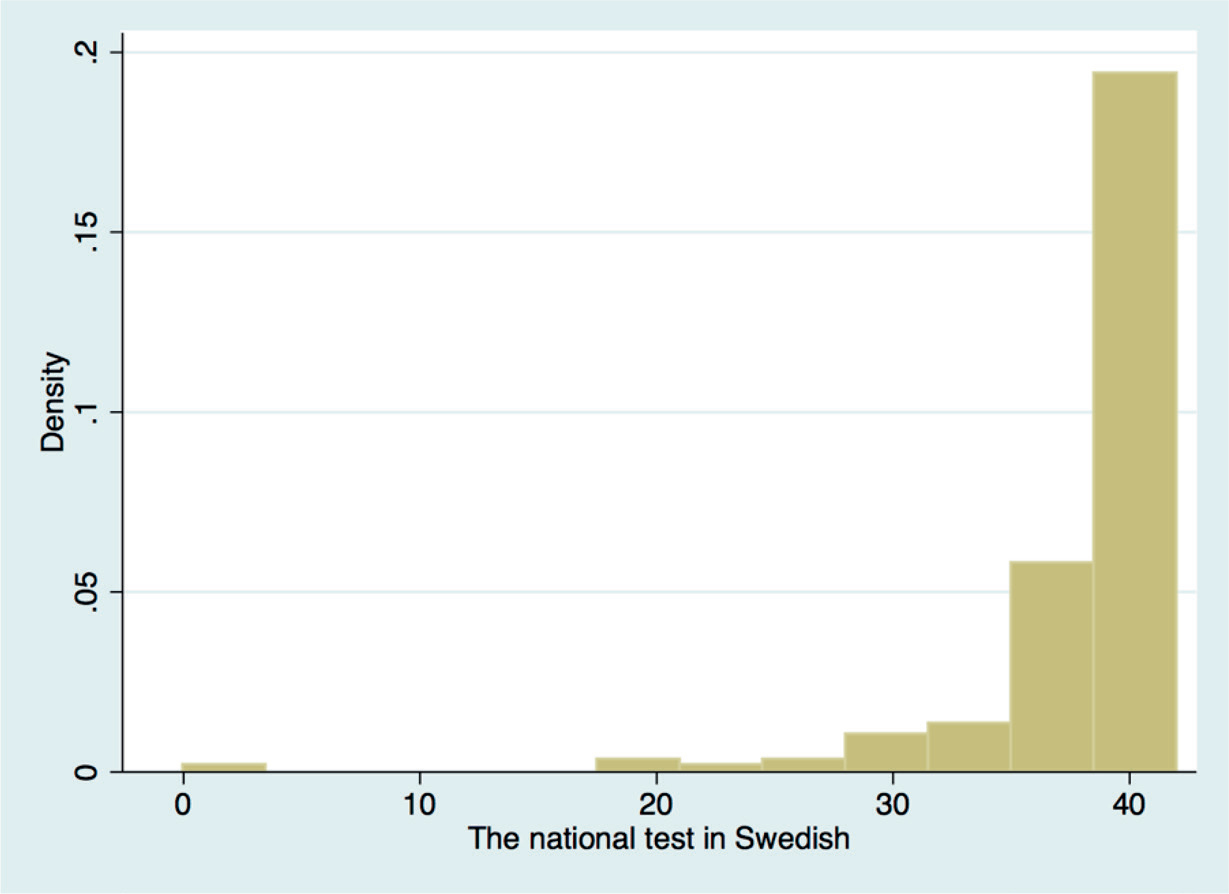
The national tests in Grade 3 have clear ceiling effects as can be seen in the density histogram in Figure 3, which shows the frequency density on the y-axis. About 25% of the students in the control schools and in the project schools have the highest score on the test (42 points).
A majority of the students in the present study as well as on a national level are graded with pass on the subtests (see Table 6). The subtests B (reading a narrative text) and C (reading a factual text) are graded as fail or pass and also with 0–18 points, respectively. For comparison, the national share of students who passed the national tests in Grade 3 has been added to the table (Skolverket, 2015b).
The magnitudes of the mean differences between control schools and project schools were estimated using effect sizes. In Table 6, a medium effect in favour of the project schools can be noted in the subtest where students are asked to write an expository essay. A small effect in favour of the project schools is noted in the subtest where the students read a narrative text and where they read a factual text. It should be kept in mind that the national tests in Grade 3 are not designed to differentiate between students.
| Subtest | Type of schools | n | Mean | SD | Share of pass (%) in sample | Share of pass (%) Sweden | Mean difference | Effect size (Cohen’s d) |
|---|---|---|---|---|---|---|---|---|
| A. Speak | Control | 59 | 1.0 | 0.1 | 98 | 99 | 0.0 | -0.1 |
| Project | 110 | 1.0 | 0.1 | 99 | ||||
| D. Reading out loud | Control | 59 | 1.0 | 0.1 | 98 | 98 | 0.0 | 0.0 |
| Project | 110 | 1.0 | 0.1 | 98 | ||||
| E. Text conversations | Control | 59 | 1.0 | 0.1 | 98 | 99 | 0.0 | 0.0 |
| Project | 110 | 1.0 | 0.1 | 98 | ||||
| F. Write a narrative text | Control | 59 | 0.9 | 0.3 | 93 | 93 | 0.0 | -0.1 |
| Project | 110 | 1.0 | 0.2 | 95 | ||||
| G. Write, spelling | Control | 59 | 0.9 | 0.3 | 86 | 92 | -0.1 | -0.2 |
| Project | 110 | 0.9 | 0.3 | 93 | ||||
| H. Write an expository essay | Control | 59 | 0.8 | 0.4 | 83 | 90 | -0.1 | -0.5b |
| Project | 110 | 1.0 | 0.2 | 96 | ||||
| B. Read a factual text (points) | Control | 59 | 16.0 | 3.2 | 92 | 96 | -0.8 | -0.4a |
| Project | 110 | 16.8 | 1.6 | 97 | ||||
| C. Read a narrative text (points) | Control | 59 | 15.8 | 3.3 | 88 | 94 | -0.7 | -0.3a |
| Project | 110 | 16.5 | 1.9 | 95 |
Note. aSmall and bmedium effect sizes.
A multiple regression analysis where the national test in Swedish in Grade 3 was used as the dependent variable was performed (see Table 7) to estimate the effect of the teaching method (project school) while taking other variables into account. The students’ results, all subtests included (see Table 6) had a range of 0 to 42 points. In Model 1, we controlled for remedial education (the total hours in school year one to three), a measure of socioeconomic background, gender, the performance on the phonological tests in the first grade, the time of the year when the student was born (Month), Swedish as the first language (L1), and changes of teachers. The results in Table 7 show that students who were taught in the project schools performed two points better on the national test in Swedish in Grade 3 than the control schools when the other variables were taken into account. In other words, this result indicates that in the present sample, the students who were learning to read with computers had 2 points more on the national test, on average, than the students taught with traditional methods. In this model, 23% of the variance was explained.
| Variable | Model 1
B |
Model 2
B |
|---|---|---|
| Project school | 2.01* | 2.41** |
| Socioeconomic status | 0.08 | 0.15 |
| Girl | 0.34 | 0.77 |
| Phonological index | 0.14** | 0.25** |
| Remedial education hours | -0.08** | - |
| Swedish L1 | 0.56 | - |
| Changes of teachers | -0.76 | 0.45 |
| Month | -0.14 | -0.23* |
| Constant | 33.76** | 29.64** |
| Observations | 163 | 121 |
| R-squared | 0.23 | 0.24 |
Note. In Model 1, all students were included. In Model 2, students having remedial education were excluded.
**p < .01, *p < .05
The next step was to perform a regression analysis where students who received remedial education were excluded (Model 2 in Table 7). This analysis showed an unchanged result for the project schools compared to Model 1. If a student was taught in a project school, then he or she received almost the same addition in points on the test, on average.
The Results on the Good Reading Development and Reading Chains Mapping Material
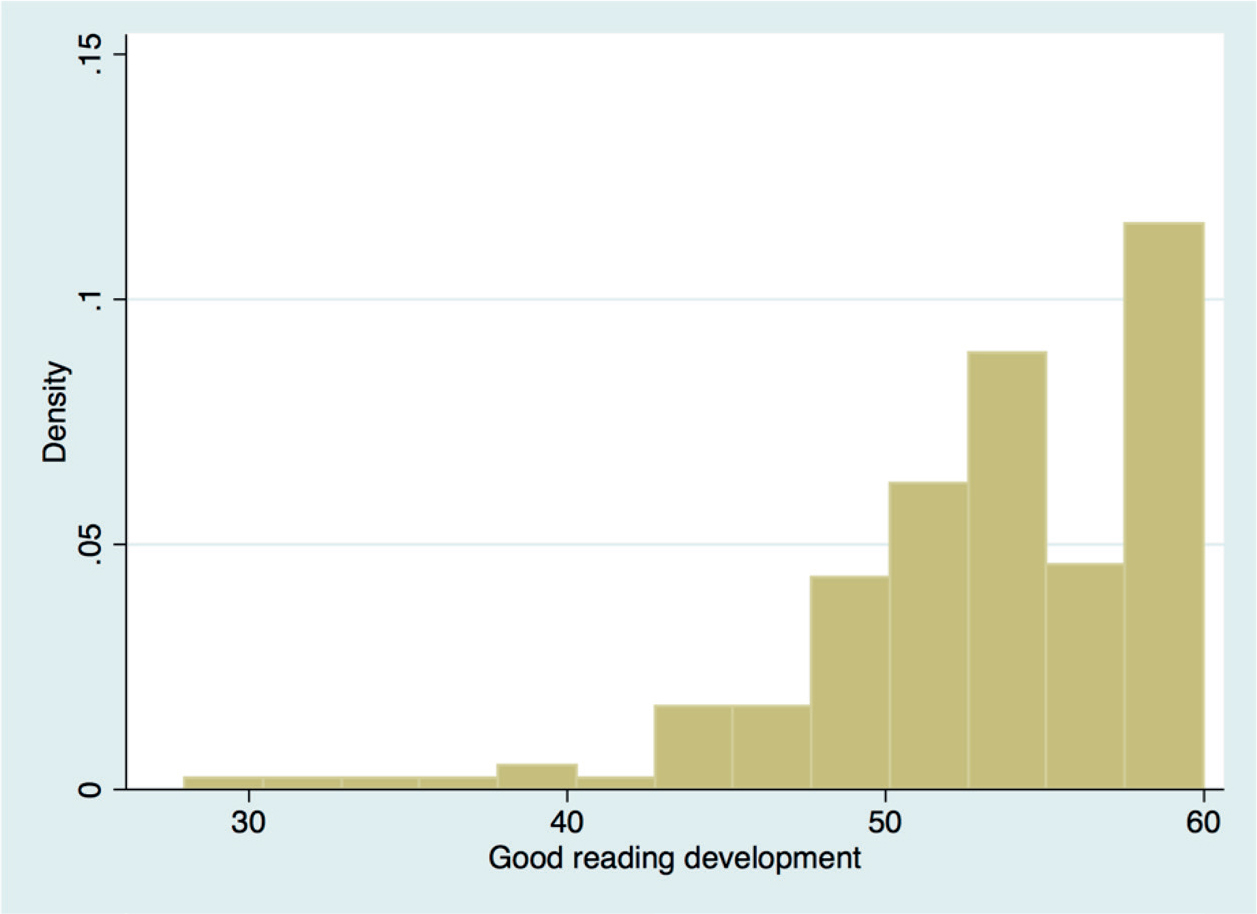
The results from the Good Reading Development mapping material (Figure 4) were not normally distributed but had slightly less ceiling effects than the national test.
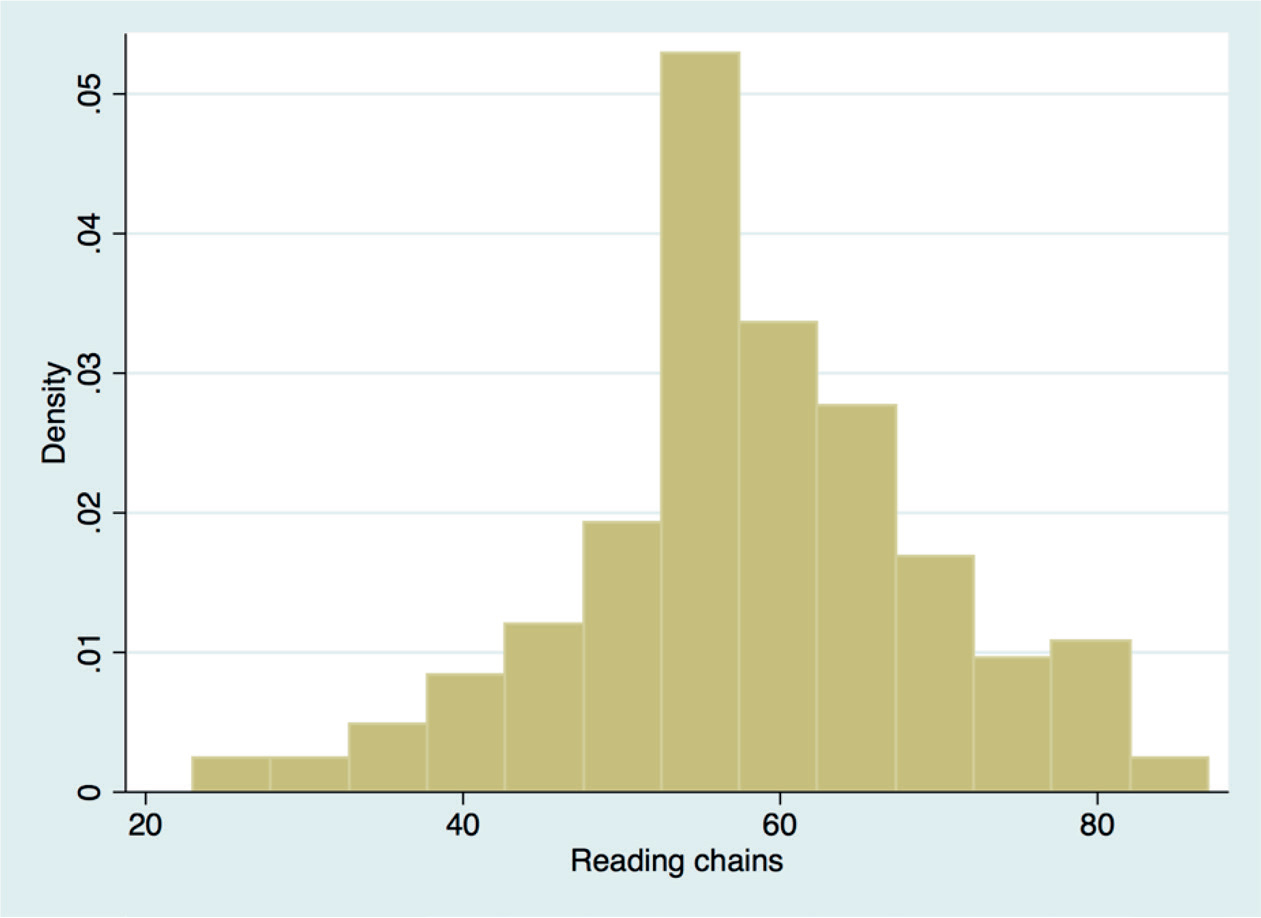
The Reading Chain test (the sum of the two tests of letter chains and word chains) in Grade 3 had an almost normal distribution (see Figure 5). This test is well triedout and standardized, and it measures the students’ word recognition and worddecoding skills.
When the effect sizes for the differences between project and control schools were computed for the tests/mapping material in the third grade, it can be seen that two of the subareas in Good Reading Development have small and medium effect sizes in advantage to the project schools (see Table 8). However, the two Reading Chain tests showed small and medium effect sizes in the opposite direction; the students in the control schools performed better than the project schools in these tests.
| Reading tests | Type of schools | Number of students | Mean | SD | Mean difference | Effect size (Cohen’s d) |
|---|---|---|---|---|---|---|
| Phonological awarenessa | Control schools | 59 | 9.8 | 1.2 | -0.2 | -0.3a |
| Project schools | 110 | 10.0 | 0.0 | |||
| Decoding wordsa | Control schools | 59 | 12.9 | 0.6 | 0.1 | 0.2 |
| Project schools | 110 | 12.8 | 0.6 | |||
| Fluency readinga | Control schools | 59 | 7.5 | 1.4 | 0.0 | 0.0 |
| Project schools | 110 | 7.5 | 0.7 | |||
| Reading comprehensiona | Control schools | 59 | 14.6 | 3.2 | -0.9 | -0.4a |
| Project schools | 110 | 15.5 | 2.0 | |||
| Reading interesta | Control schools | 59 | 7.9 | 2.8 | -0.1 | 0.0 |
| Project schools | 110 | 8.0 | 2.7 | |||
| Reading chains lettersb | Control schools | 59 | 37.8 | 6.3 | 3.0 | 0.5b |
| Project schools | 110 | 34.8 | 6.4 | |||
| Reading chains wordsb | Control schools | 59 | 24.0 | 8.0 | 2.4 | 0.3a |
| Project schools | 110 | 21.6 | 6.9 | |||
| Which picture is correct? b | Control schools | 59 | 26.2 | 8.2 | 1.7 | 0.2 |
| Project schools | 110 | 24.5 | 6.1 |
Note. Small (a) and medium (b) effect sizes in bold.
aThe subtests in Good Reading Development, spring 2015. bTests during the autumn 2014.
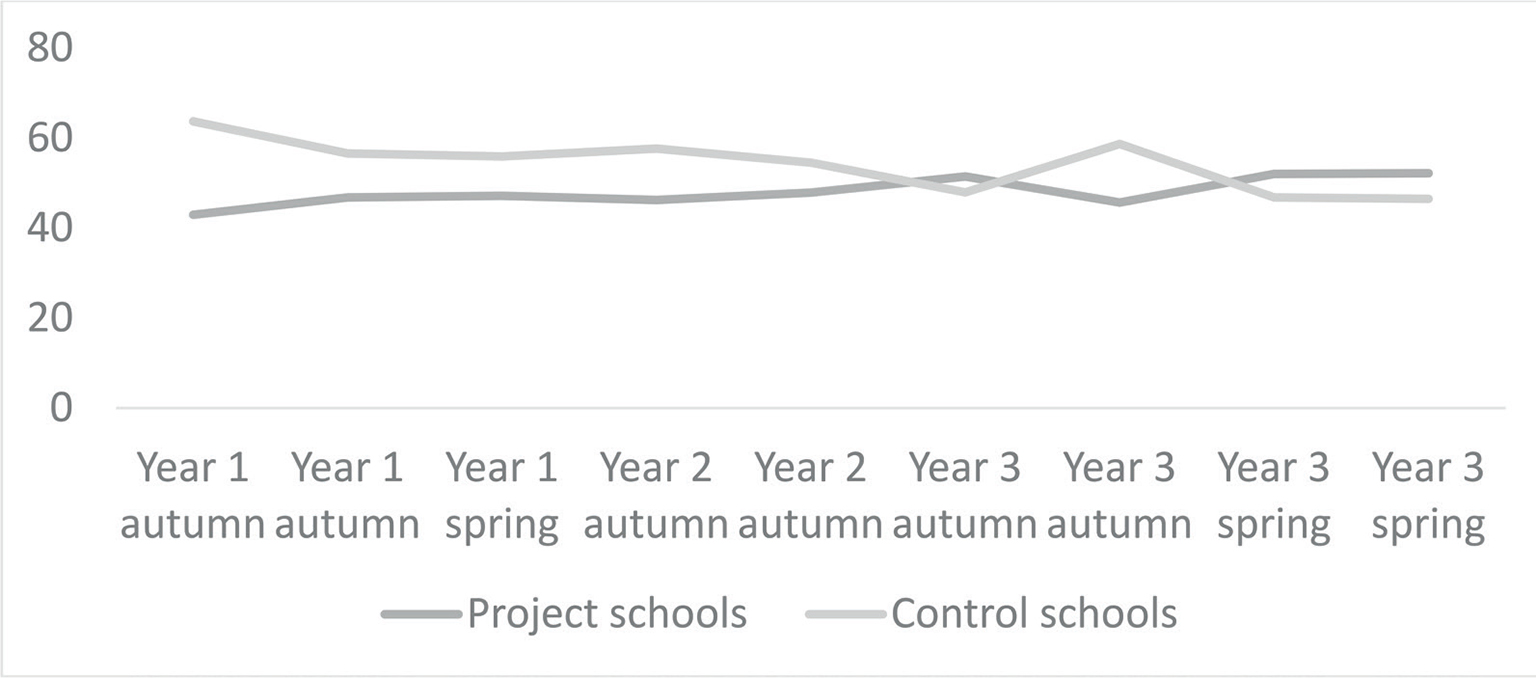
To compare the results over time for the various tests, we computed the percentile ranks for the tests to have all the results on the same scale. Figure 6 shows that the students in the project schools were outperformed by the students in the control schools in Grade 1, but in Grade 3 they performed slightly better than the control schools on three out of four tests. The small increase in performance in the project schools could be explained by the teaching method, the extra in-service training, or by the extra remedial education in the project schools. However, the control schools performed better than the project schools on the Reading Chains test in the third grade.
The tests presented in Figure 6 are Fonolek (autumn Year 1), Good Reading Development (autumn Year 1), Good Reading Development (spring Year 1), Reading Chains (autumn Year 2), Good Reading Development (autumn Year 2), Good Reading Development (autumn Year 3), Reading Chains (spring Year 3), and the national test in Swedish (spring Year 3). If we look at the percentile ranks (see the Analysis section for a description of the calculation) for the three tests in the third grade, it showed that the students in the control school managed the Reading Chains better than the students in the project schools (see Table 9). The project schools showed better results than the control schools on the national test and the Good Reading Development mapping material.
| Variable | n | Mean |
|---|---|---|
| Control schools | ||
| Reading chains | 59 | 58.66 |
| National test | 59 | 46.49 |
| Good reading development | 59 | 46.80 |
| Project schools | ||
| Reading chains 3 | 110 | 45.67 |
| National test | 110 | 52.20 |
| Good reading development | 110 | 52.04 |
The results for the three tests/mapping materials (Reading Chains, national test, and Good Reading Development) for project schools and control schools showed a larger difference between project and control schools for boys than girls when the percentile ranks are compared (see Table 10). However, in two of the tests the results for the boys were better in the project schools than in the control schools and in one test it was the other way around.
In Model 1 in the regression analysis in Table 11, we used the results from the Good Reading Development mapping material as the dependent variable. This mapping material had a larger variation than the national test and the ceiling effects were not as apparent. The students’ results had a range of 28 to 60 points in this material. This regression analysis shows significant coefficients for project schools, girls, phonological index, hours of remedial education, and changes of teachers.
| Reading Chains 3 | National Test | Good Reading Development | |||||||
|---|---|---|---|---|---|---|---|---|---|
| Control school | Project school | Diff control-project | Control school | Project school | Diff control-project | Control school | Project school | Diff control-project | |
| Girls | |||||||||
| n | 28 | 49 | 28 | 49 | 28 | 49 | |||
| Mean | 60.71 | 54.06 | 6.65 | 53.29 | 56.22 | -2.93 | 57.18 | 55.02 | 2.16 |
| Boys | |||||||||
| n | 31 | 61 | 31 | 61 | 31 | 61 | |||
| Mean | 56.81 | 38.93 | 17.88 | 40.35 | 48.97 | -8.62 | 37.42 | 49.64 | -12.22 |
| Variable | Model 1
B |
Model 2
B |
|---|---|---|
| Project school | 2.19** | -4.06** |
| Socioeconomic Status | 0.04 | -0.09 |
| Girl | 1.35* | 3.5** |
| Phonological index | 0.21*** | 0.22 |
| Remedial education hours | -0.08*** | -0.11* |
| Changes of teachers | -2.91*** | -3.55** |
| Month | -0.06 | -0.49** |
| Constant | 47.08*** | 58.67*** |
| Observations | 164 | 164 |
| R-squared | 0.25 | 0.190 |
Note. In model 2, reading chains in grade 3 was the dependent variable.
***p < .01, **p < .05, *p < .1.
In Table 11, Model 2, the Reading Chains test was used as the dependent variable in a regression model. This test had a range of 23 to 87 points. The results point in the opposite direction compared to the national test and the Good Reading Development test regarding the project schools. The students received 4 points less on this test if they attended a project school when the other variables in table 11 were taken into account. Moreover, the phonological index from Grade 1 did not contribute in explaining the variance in the results on Reading Chains in this model.
In sum, it is not possible to provide clear evidence that the teaching method, learning to read through writing on computers, in the project schools had a more positive impact on the students’ reading development compared, in the present sample, to the traditional methods in the control schools. In two cases, the national test and Good Reading Development, the students performed slightly better in the project schools also after controlling for remedial education, gender, and other variables. On the other hand, the results from the Reading Chains test showed that the control schools outperformed the project schools, also when controlling for several variables. Below, we will discuss the results and the limitations of the study.
Limitations
Before we discuss the results it is important to highlight some of the limitations of the study. The study had a quasi-experimental design, which means that it was not possible to randomly assign students and teachers to the project or the control schools. This is a problem that means possible school and teacher effects could occur. By controlling for different factors (see Table 12), we have tried to minimize these risks, but there are obviously a number of factors that are very difficult to control for.
Another clear limitation was that the municipality included three different interventions in the project schools at the same time (i.e., the method to learn to read through writing on computers, the extra remedial education, and the extra in-service training for the teachers). This made it difficult to isolate the effect of each of these interventions. It was possible to control for the time spent on remedial education, but it cannot be excluded that early remedial education could have had other positive effects that could not be controlled for. It was not possible to control for the in-service training. We know from earlier research that teachers’ competence and in-service training have a positive impact on teachers’ instruction (see, e.g., Barber & Mourshed, 2007; Hill, 2007; OECD, 2009) and that the positive impacts of the use of technology in education increase when teachers have received training specifically related to this (Archer et al., 2014).
Another problem was that two of the tests/mapping materials used in Grade 3 were not designed to differentiate between students. The national test in Swedish in Grade 3 has the purpose of testing whether the students reach the objectives for Grade 3 in the curriculum. The national tests have also been criticized because they have failed to identify students with dyslexia (Herkner, 2011; Herkner, Westling Allodi & Olofsson, 2014) and that the level of difficulty has been considered too low among teachers (SOU 2016:25). The Good Reading Development mapping material is designed to support the teachers’ formative assessment of the students’ development. The third test, Reading Chains, was most suited for evaluation purposes, but it only measures some of the skills needed to read and write (i.e., word recognition and decoding skills). Unfortunately, the Good Reading Development mapping material and the national test are not well-suited for this type of evaluation and had ceiling effects.
Discussion
The overall aim of the study was to evaluate the effect of the teaching method in reading and writing using computers in the project schools. The purpose of the study was two-fold: (a) to investigate if there were any differences between the schools in respect of students’ reading and writing skills at the beginning of Grade 1 and at the end of Grade 3 and (b) to see if possible differences between the students in the schools can be explained by the use of computers.
It is not possible to give conclusive evidence that the traditional teaching in the control schools gave better reading and writing development, or the other way around, with the teaching with computers in the project schools. It seems clear that the students in the control schools managed decoding and word recognition better than the students in the project schools in the autumn semester of the third grade. This could be due to the slightly higher level that the students in the control schools had to start with, but even when we controlled for the phonological awareness in Grade 1 the control school students outperformed the project school students in the Reading Chains test. As mentioned in the Limitations section, the Good Reading Development mapping material and the national test had ceiling effects. Nonetheless, they showed slightly better results for the project schools. A possible reason could be that they also include different skills and the national test includes a large degree of writing. The students in the project schools wrote on their computers and could possibly have practiced writing more than the control school students.
When boys’ and girls’ achievements were compared, it was clear that the differences between the boys, in the project and control schools, were larger than between the girls. Gender accounted for a large part of the difference, in that the boys managed the Reading Chains test better in the control schools and the national test and the Good Reading Development mapping material better in the project schools. The girls seemed to be less sensitive to the teaching methods and managed the tests similarly in both the project and the control schools. However, the regression analysis using the national test as the dependent variable gave no additional effect when adding gender to the model, when the effects of all other variables in the model were accounted for, but when Good Reading Development and Reading Chains were used there was a significant effect for gender in favour of the girls.
It could be argued that the results are possible to generalize to other similar Swedish schools because the variation in student background in the present sample is similar to many Swedish schools regarding parents’ educational level but the share of immigrant students is slightly lower in the sample compared to the national average. Nevertheless, it should be kept in mind that the schools included in the sample had a lower share of students with an immigrant background than the average school in Sweden.
The results from this study are in line with results from earlier research discussed in a previous section, both research on the use of computers in general in reading and writing instruction (Hattie, 2009; Håkansson & Sundberg, 2012; NICHD, 2000; Taube et al., 2015) and the more specific approach referred to as “learning to read through writing on computers” (Agélii Genlott & Grönlund, 2013; Agélii Genlott & Grönlund, 2016; Folkeson, 2004; Folkesson & Swalander, 2007; Liberg, 2014). In the same way as in earlier research, the results in this article are mixed and do not give strong support to the assumption that the use of computers in reading and writing instruction is better than more traditional reading instruction, but it also does not give support for an assumption that the use of computers in reading and writing instruction should be less good than the traditional reading and writing instruction. Some of the results could also be interpreted as being in line with earlier findings that there may be more of an advantage for the use of computers when it comes to writing skills than to reading skills.
Conclusions
The results showed that although the control schools had a slight advantage in Grade 1, the project schools caught up and the project students performed slightly better on the national test and the Good Reading Development mapping material in Grade 3. However, the students in the control schools, with traditional teaching, outperformed the students in the project schools on the Reading Chains test, designed to measure word recognition and decoding skills. Despite extra resources for teacher in-service training, additional support, and digital technology, the control schools presented results comparable to those of the project schools. The time spent in remedial education was controlled for, but it was not possible to separate the possible effects of extra in-service training for the teachers in the project schools since data on the amount of in-service training was missing. Moreover, the authors have the intention to make further analyses of the material in other articles, but then with focus on the impact of the remedial education.
References
- Agélii Genlott, A. & Grönlund, Å. (2013). Improving literacy skills through learning reading by writing: The iWTR method presented and tested. Computers & Education, 67, 98–104.
- Agélii Genlott, A. & Grönlund, Å. (2016). Closing the gaps – Improving literacy and mathematics by ictenhanced collaboration. Computers & Education, 99, 68–80.
- Archer, K., Savage, R., Sanghera-Sidhu, S., Wood, E., Gottardo, A. & Chen, V. (2014). Examining the effectiveness of technology use in classrooms: A tertiary meta-analysis. Computers & Education, 78, 140–149.
- Fredriksson, U. (2002). Reading skills among students of immigrant origin in Stockholm. Stockholm: Institute of International Education, Stockholm University.
- Fredriksson, U., Rasmusson, M., Eliasson, N., Pettersson, A., Sollerman, S. & Taube, K. (2018a). Flickor och pojkar i PISA-undersökningarna [Girls and boys in the PISA-studies]. In U. Fredriksson, K. G. Karlsson, & A. Pettersson (Eds.), PISA under 15 år – resultat och trender [PISA during 15 years – results and trends] (pp. 131–146). Stockholm: Natur & Kultur.
- Fredriksson, U., Rasmusson, M., Eliasson, N., Oskarsson, M., Pettersson, A., Sollerman, S. & Karlsson, K. G. (2018b). Inhemska elever och elever med utländsk bakgrund i PISA [Domestic students and students with foreign background]. In U. Fredriksson, K. G. Karlsson, & A. Pettersson (Eds.) PISA under 15 år – resultat och trender [PISA during 15 years – results and trends] (pp. 147–160). Stockholm: Natur & Kultur.
- Fredriksson, U. & Taube, K. (2001). Läsning bland elever med invandrarbakgrund: En undersökning av läsförmåga och bakgrundsfaktorer hos elever i årskurs 3 i Stockholm 1993 – 1996 [Reading among students with migration background: A study of reading skills and background factors among students in grade 3 in Stockholm 1993–1996]. Stockholm: Institutionen för internationell pedagogik, Stockholms universitet.
- Fredriksson, U. & Taube, K. (2012). Läsning, läsvanor och läsundersökningar [Reading, reading habits and reading studies]. Lund: Studentlitteratur.
- Barber, M. & Mourshed, M. (2007). How the world’s best-performing school systems came out on top (The McKinsey Report). London: McKinsey.
- Bengtsson, E., Dickman, G., Öhman, K. & Magnusson, G. (2003). SpråkSkrin 1 [LanguageScreen 1].Tranås: SoftOgram AB.
- Cohen, J. (1988). Statistical power analysis for the behavioral sciences (2nd ed.). Hillsdale, NJ: Lawrence Erlbaum.
- Folkesson, A-M. (2004). Datorn i det dialogiska klassrummet. En fallstudie av läs- och skrivprocessen i år 1–3. [The computer in the dialogical classroom. A case study of reading and writing processes in grade 1–3] Lund: Studentlitteratur.
- Folkesson, A-M. & Swalander, L. (2007). Self-regulated learning through writing on computers: Consequences for reading comprehension. Computers in Human Behavior, 23, 2488–2508.
- Hart, B. & Risley, T. R. (1995). Meaningful differences in the everyday experience of young American children. Baltimore, MD: Brookes.
- Hattie, J. (2009). Visible learning: A synthesis of over 800 meta-analyses relating to achievement. London: Routledge.
- Heckman, J. J. (1979). Sample selection bias as a specification error. Econometrica: Journal of the econometric society, 153–161.
- Hemmingsson, I. (1992) Fonolek – Bedömning av fonologisk medvetenhet [Fonolek – Assessment of phonological awareness]. Brunflo: Hemmingsson.
- Herkner, B. (2011). Läsutveckling i årskurs 2–6 belyst genom standardiserade test och nationella provet i svenska i årskurs 3. Vetenskaplig uppsats för filosofie licentiatexamen [Reading development in grade 2–6 showed through standardised tests and national tests in Swedish in grade 3. Scientific essay for the licenciate exam]. Stockholm: Specialpedagogiska institutionen, Stockholms universitet.
- Herkner, B., Westling Allodi, M. & Olofsson, Å. (2014). Early identification or broken promises? A comparison of literacy assessment performance in 112 Swedish third graders. European Journal of Special Needs Education, 29(2), 237–246.
- Hill, H. (2007). Learning in the teaching force. In The Future of Children (pp. 111–127). Princeton, NJ: Princeton University.
- Hultin, E. & Westman, M. (Eds.). (2014). Att skriva sig till läsning - erfarenheter och analyser av det digitaliserade klassrummet [To learn to read through writing – Experiences and analysis of the digitialised classroom]. Malmö: Gleerups.
- Håkansson, J. & Sundberg, D. (2012). Utmärkt undervisning: framgångsfaktorer i svensk och internationell belysning [Excellent teaching: Success factors highlighted from a Swedish and an international perspective]. Stockholm: Natur & Kultur.
- Jacobsson, C. (2001). Läskedjor. Manual. [Reading Chains. Manual]. Stockholm: Hogrefe Psykogiförlaget.
- Järpsten, B. & Taube, K. (2013). DLS för åk 2–3, Handledning [DLS for grade 2–3. Instructions]. Stockholm: Hogrefe Psykologiförlaget.
- Liberg, C. (2014). Att använda dator i tidig läs- och skrivundervisning 2011 – 2014, Uppsala kommun: Slutrapport för ASL-projektet [To use computers early in the reading and writing instruction 2011–2014. Uppsala Municipality. Final report from the ASL project]. Uppsala: Institutionen för pedagogik, didaktik och utbildningsstudier, Uppsala universitet.
- Lundberg, I. & Herrlin. K. (2003) God läsutveckling: kartläggning och övningar. [Good reading development: mapping and exercises]. Stockholm: Natur och Kultur.
- Lövgren, E. (2009) Med datorn som skrivverktyg – språk, motorik och bokstavsformer [With the computer as a writing tool – Language, motoric and letter forms]. Stockholm: Sanoma Utbildning.
- Mellander, E. & Svärdh, J. (2017). Tre lärdomar från en effektutvärdering av lärarstödsprogrammet NTA (Naturvetenskap och teknik för alla) [Three lessons from an effect evaluation of the Swedish Science and Technology for Children Programme]. Nordina, 13(2), 163–179.
- National Institute of Child Health and Human Development (NICHD). (2000). Report of the National Reading Panel. Teaching children to read: An evidence-based assessment of the scientific research literature on reading and its implications for reading instruction: Reports of the subgroups (NIH Publication No. 00-4754). Washington, DC: US Government Printing Office.
- OECD. (2001). Knowledge and skills for life: First results from PISA 2000. Paris: OECD.
- OECD. (2009). Preliminary recommendations on school management and teacher policy in Mexico. OECD Steering Group on School Management and Teacher Policy in Mexico. Paris: OECD.
- Pedhazur, E. J. & Pedhazur Schmelkin, L. (1991). Measurement, design, and analysis: An integrated approach. New York, NY: Psychology Press.
- Scarborough, H. (1998). Early identification of children at risk for reading disabilities. Phonological awareness and some other promising predictions. In B. K. Scarpio, P. J Accordo & A. J. Capute (Eds.), Specific reading disability. A review of the spectrum (pp. 75–119). Maryland: York Press.
- Skolverket. (2010). Rustad att möta framtiden? PISA 2009 om 15-åringars läsförståelse och kunskaper i matematik och naturvetenskap [Prepared to meet the future? PISA 2009 about 15 year olds’ reading comprehension and knowledge in mathematics and science]. Stockholm: Skolverket.
- Skolverket. (2012). PIRLS 2011. Läsförmågan hos svenska elever i årskurs 4 i ett internationellt perspektiv [PIRLS 2001: Reading ability among Swedish grade 4 students in an international perspective]. Stockholm: Skolverket.
- Skolverket. (2015a). Ämnesprov, läsår 2014/2015. Svenska och svenska som andraspråk. Lärarinformation. [Subject test, school year 2014/2015. Swedish and Swedish as a second language]. Stockholm: Skolverket.
- Skolverket. (2015b). Resultat på nationella prov i årskurs 3, 6 och 9, läsåret 2014/15 [Results from national tests in grade 3, 6 and 9 school year 2014/2015]. Stockholm: Skolverket.
- Skolverket. (2018). Sök statistik [Search for statistics]. Retrieved from https://www.skolverket.se/skolutveckling/statistik/sok-statistik-om-forskola-skola-och-vuxenutbildning
- Slavin, R. E. (1991). Reading effects of IBM’s “Writing to Read” program: A review of evaluations. Educational Evaluation and Policy Analysis, 13(1), 1–11.
- Snow, C., Burns, S. & Griffin, P. (Eds.) (1998). Preventing Reading Difficulties in Young Children. Washington, D.C.: National Academy Press.
- Stanovich, K. E. (2000). Progress in understanding reading: Scientific foundations and new frontiers. New York, NY: The Guildford Press.
- StataCorp. (2015). Stata Statistical Software: Release 14 [Computer software]. College Station, TX: StataCorp LP.
- SOU 2016:25. (2016). Likvärdigt, rättssäkert och effektivt – ett nytt nationellt system för kunskapsbedömning. Betänkande av Utredningen om nationella prov [Equity, legal security and efficiency – a new national system for knowledge assessment. Suggestions from the inquiry on national test]. Stockholm: Wolters Kluwer.
- Taube, K. (2007) Barns tidiga läsning [Children’s early reading]. Stockholm: Norstedts Akademiska Förlag.
- Taube, K. (2011). Barns tidiga skrivande. [Children’s early writing]. Stockholm: Norstedts.
- Taube, K., Fredriksson, U. & Olofsson, Å. (2015). Kunskapsöversikt om läs- och skrivundervisning för yngre elever [A knowledge overview of reading and writing instruction for younger children]. Stockholm: Vetenskapsrådet.
- Trageton, A. (2005). Att skriva sig till läsning – IKT i förskoleklass och skola [To learn to read through writing – ICT in pre-school classes and in school]. Stockholm: Liber.
- Trageton A. (2014). Att skriva sig till läsning – IKT i förskoleklass och skola. Ny upplaga [To learn to read through writing – ICT in pre-school classes and in school. New edition]. Stockholm: Liber.
- Wagemaker, H. (Ed.). (1996). Are girls better readers? Gender differences in reading literacy in 32 countries. Amsterdam: IEA.
- Wilkinson, L. (1999). Statistical methods in psychology journals: Guidelines and explanations. American psychologist, 54(8), 59.